Olivia Lehmann · 12 October 2026
Tracing Performance Variations in Content Systems After Network Record Adjustments
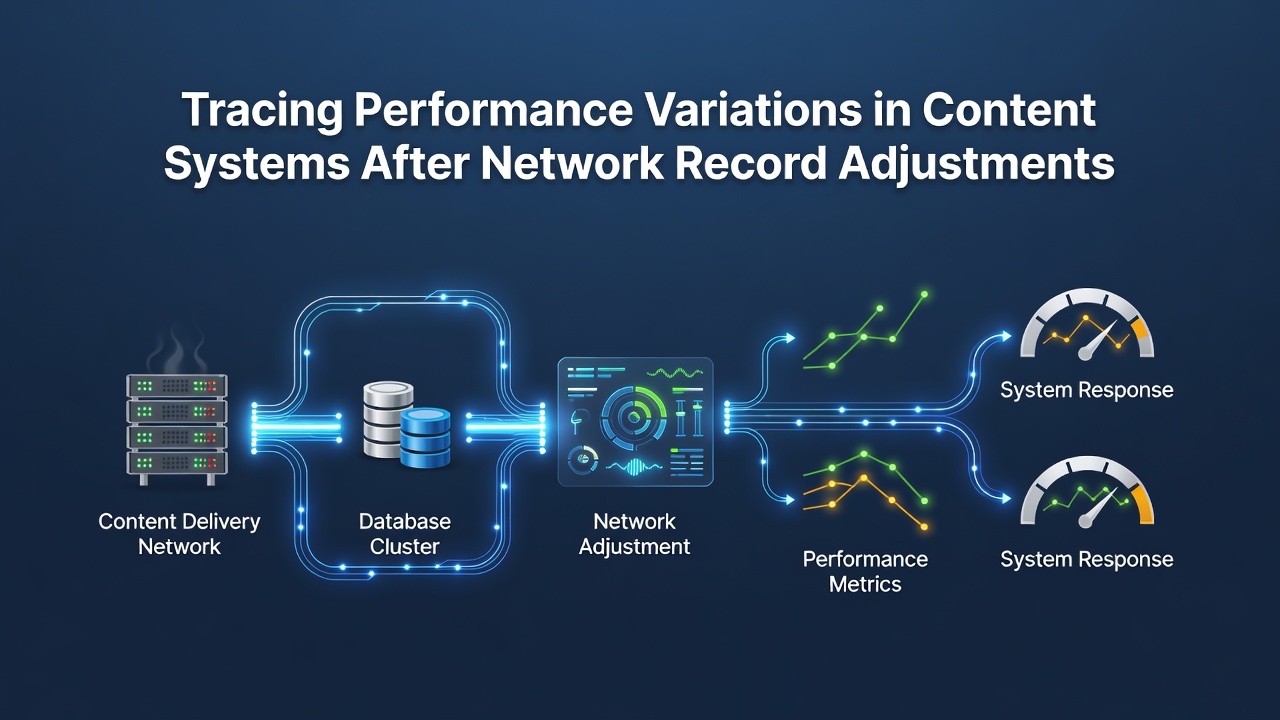
Network record adjustments such as modifications to A records, CNAME entries, and TTL values often trigger measurable shifts in how content systems deliver data across distributed platforms, and observers note that these changes require systematic tracing to isolate variations in latency, throughput, and error rates. Researchers have documented cases where even minor record updates lead to rerouting of traffic through different edge servers, which in turn affects load times for users accessing cached resources. Data from multiple monitoring setups shows that performance can fluctuate within the first 24 to 72 hours after propagation completes, with some systems experiencing temporary spikes in response times while others stabilize more quickly depending on the underlying CDN configuration.
Key Metrics Used in Performance Tracing
Teams responsible for content platforms track several indicators when network records shift, including time to first byte, cache hit ratios, and packet loss percentages, while tools aggregate these values across regions to produce comparable baselines. Studies indicate that variations appear most clearly when comparing pre-adjustment logs against post-adjustment samples collected at consistent intervals, and analysts use synthetic monitoring alongside real-user data to separate network-level effects from application-level ones. Evidence from infrastructure reports reveals that DNS resolver differences across geographic zones can amplify or dampen these variations, which explains why some users see improvements while others encounter brief degradation.
Tracing Techniques and Data Collection Approaches
Automated scripts combined with passive observation points allow continuous capture of response headers and connection details after record changes take effect, and this method helps identify whether delays stem from authoritative server responses or from intermediate resolver caching. Observers have found that logging full propagation timelines alongside performance counters provides clearer insight into cause-and-effect relationships, especially when multiple record types undergo simultaneous updates. Research indicates that integrating these logs with time-series databases enables teams to correlate specific record modifications with measurable drops or gains in availability metrics.
One documented instance involved a mid-sized publishing platform that adjusted its primary A record to point toward a new anycast network, after which monitoring revealed a 15 percent reduction in average latency for North American visitors but a temporary increase for European traffic until secondary records propagated fully. Such patterns emerge because global DNS hierarchies do not update uniformly, and tracing tools that sample from diverse vantage points help map these inconsistencies over time.
Impact Observed in October 2026 Reports
Figures released in October 2026 from distributed monitoring networks highlighted that content systems undergoing record adjustments during peak traffic periods showed greater variance in error rates compared with those scheduled during off-peak windows, and the data pointed to resolver congestion as a contributing factor in several regions. Analysts cross-referenced these findings with BGP route announcements to determine whether network-layer path changes coincided with the DNS modifications, which produced more precise attribution of performance shifts. Reports from that period also noted that platforms employing shorter TTL values recovered baseline performance metrics faster once the adjustments stabilized.
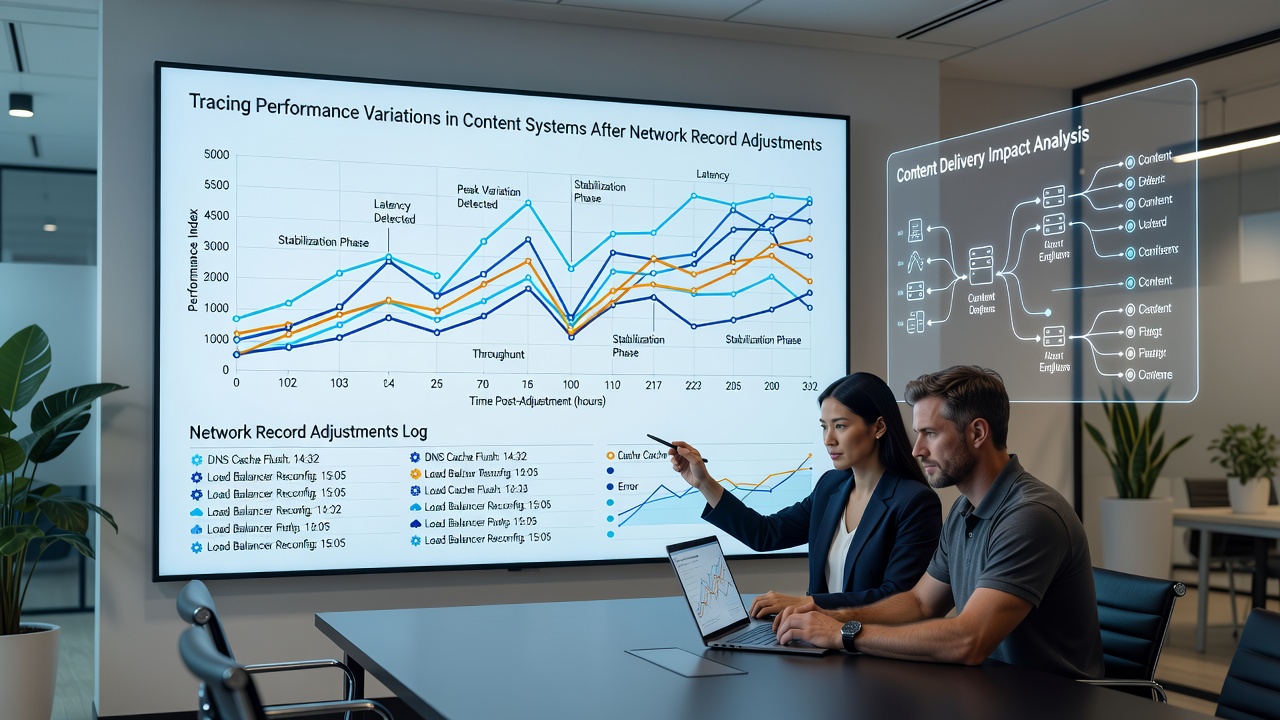
Additional techniques involve comparing traceroute outputs before and after changes to visualize altered paths through the network, and this approach has proven useful when combined with application-level timing data. Experts emphasize collecting samples at multiple layers because single-metric views can mask underlying causes such as increased hop counts or congestion at peering points.
Tools and Frameworks Supporting Detailed Analysis
Software suites designed for observability allow teams to set automated alerts when key thresholds are crossed after record updates, and these systems often incorporate machine learning models trained on historical adjustment events to flag anomalies more rapidly. Data collected through open-source agents deployed at edge locations has contributed to public datasets that researchers use to study broader patterns across different content delivery architectures. According to analysis published by the National Institute of Standards and Technology, consistent sampling intervals improve the reliability of variation detection in large-scale environments.
Another study coordinated through academic institutions in Australia examined how record adjustments interact with IPv6 transition mechanisms, revealing that dual-stack configurations sometimes introduced additional variability during the initial hours after changes. Those findings underscore the value of maintaining separate tracking for IPv4 and IPv6 performance indicators when network records are modified.
Conclusion
Systematic tracing of performance variations after network record adjustments relies on layered data collection, regional sampling, and correlation with propagation timelines, and the approaches outlined here provide frameworks that content platform operators apply to maintain visibility during transitions. Continued refinement of monitoring practices supports more accurate identification of the factors driving temporary or sustained changes in system behavior.